
Julie McCombs
Blue Ridge cheerleaders and students celebrate their win over Greer Friday night to earn a share of the Region II-AAA championship.
Julie McCombs
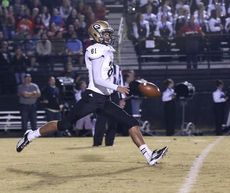
The best weapon Greer had Friday night was the punting of Jake Arrowood. He averaged 45.
Julie McCombs
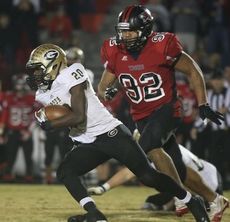
Quez Nesbitt, 20, was a non-factor in the game with only 79 yards rushing. He did not score a touchdown.
Julie McCombs
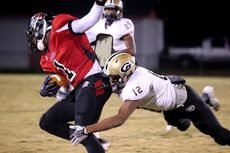
Dorian Lindsay dives to bring down Vonta Jenkins (1) on this play.
Despite the loss Greer earned the Region II-AAA No. 1 seed and has home-field advantage through the first four weeks of the playoffs.
SCORING SUMMARY
|
|
1st Quarter |
2nd Quarter |
3rd Quarter |
4th Quarter |
Total |
|
Greer |
0 |
0 |
9 |
0 |
9 |
|
Blue Ridge |
0 |
3 |
0 |
7 |
10 |
Second Quarter
Blue Ridge: Jon Michael Bright 22 field goal. 0:00. 3-0.
Third Quarter
Greer: Ty Montgomery in end zone for safety. 9:34. 3-2.
Greer: Emanuel Kelly 48 kickoff return. (Nick Roberson kick). 9:20. 3-9.
Fourth Quarter
Blue Ridge: Brian Garrett 3 touchdown pass from Montgomery. (Jon Michael Bright kick). 5:07. 10-9.
TEAM STATISTICS
|
Team |
GREER |
BLUE RIDGE |
|
Score |
9 |
10 |
|
First downs |
9 |
13 |
|
Rushes / Yards (net) |
25 / 64 |
26 / 50 |
|
Passing yards (net) |
111 |
192 |
|
Passes – Att / Comp / Int |
16 / 7 / 1 |
29 / 20 / 0 |
|
Total offense yards |
41 / 175 |
55 / 242 |
|
Punt returns / yards |
1 / 4 |
3 / 21 |
|
Kickoff returns / yards |
2 / 83 |
2 / 1 |
|
Interception return/yards |
0 / 0 |
1 / 10 |
|
Punts (Number/average) |
5 / 45.8 |
5 / 36.6 |
|
Fumbles / lost |
1 / 1 |
1 / 0 |
|
Penalties / yards |
10 / 75 |
4 / 30 |
|
Possession time |
22:00 |
26:00 |
INDIVIDUAL LEADERS
RUSHING
GREER
|
|
Attempts |
Net |
TD |
Longest |
Average |
|
Nesbitt |
17 |
79 |
0 |
30 |
4.6 |
|
Kelly |
1 |
4 |
0 |
4 |
4.0 |
|
Cusano |
7 |
-19 |
0 |
3 |
-2.7 |
|
|
|
|
|
|
|
BLUE RIDGE
|
|
Attempts |
Net |
TD |
Longest |
Average |
|
Montgomery |
14 |
30 |
0 |
15 |
2.1 |
|
Jenkins |
1 |
12 |
0 |
12 |
12.0 |
|
Smith |
6 |
6 |
0 |
5 |
1.0 |
|
Jenkins |
3 |
2 |
0 |
2 |
0.7 |
PASSING
|
|
Attempts |
Complete |
Interceptions |
Yards |
TD |
Longest |
|
GREER |
|
|
|
|
|
|
|
Cusano |
16 |
7 |
1 |
111 |
0 |
33 |
|
BLUE RIDGE |
|
|
|
|
|
|
|
Montgomery |
29 |
20 |
0 |
192 |
1 |
60 |
RECEIVING
GREER
|
|
Receptions |
Yards |
TD |
Long |
Avg. |
|
|
|
|
|
|
|
|
Lindsey |
3 |
53 |
0 |
33 |
17.6 |
|
Nesbitt |
2 |
51 |
0 |
30 |
25.5 |
|
Kelly |
2 |
7 |
0 |
11 |
3.5 |
BLUE RIDGE
|
Duck |
6 |
19 |
0 |
11 |
2.6 |
|
Jenkins |
5 |
103 |
0 |
60 |
22.0 |
|
Garrett |
4 |
16 |
1 |
7 |
4.0 |
|
Smith |
3 |
40 |
0 |
38 |
13.3 |
PUNTING
GREER
|
|
Number |
Yards |
Avg. |
TB |
I20 |
LG |
|
Arrowood |
5 |
229 |
45.8 |
0 |
3 |
60 |
BLUE RIDGE
|
Montgomery |
5 |
183 |
36.6 |
0 |
1 |
48 |
PUNT RETURNS
GREER
|
|
Number |
Yards |
TD |
Long |
|
Lindsey |
1 |
4 |
0 |
4 |
|
Total |
|
|
|
|
BLUE RIDGE
|
Jenkins |
3 |
21 |
0 |
9 |
KICK RETURNS
GREER
|
|
Number |
Yards |
TD |
Long |
|
Kelly |
2 |
83 |
1 |
68 |
BLUE RIDGE
|
Jenkins |
1 |
1 |
0 |
1 |
|
Jenkins |
1 |
1 |
0 |
1 |
|
Duck |
1 |
0 |
0 |
0 |